
Budapest’s residential market did not simply move upward over the past fifteen years. A post-FX-loan slump gave way to a low-rate boom, Covid hit the rental market, and then inflation and higher borrowing costs cooled purchasing power. After a fresh demand wave in 2025, the momentum shifted again in 2026: prices stayed high, but growth slowed and the pipeline of new homes began to expand.
The central lesson is not that “Budapest always goes up.” Different cycles favour different buyers, property types and districts. A citywide average is therefore a weak basis for a purchase or investment decision on its own.
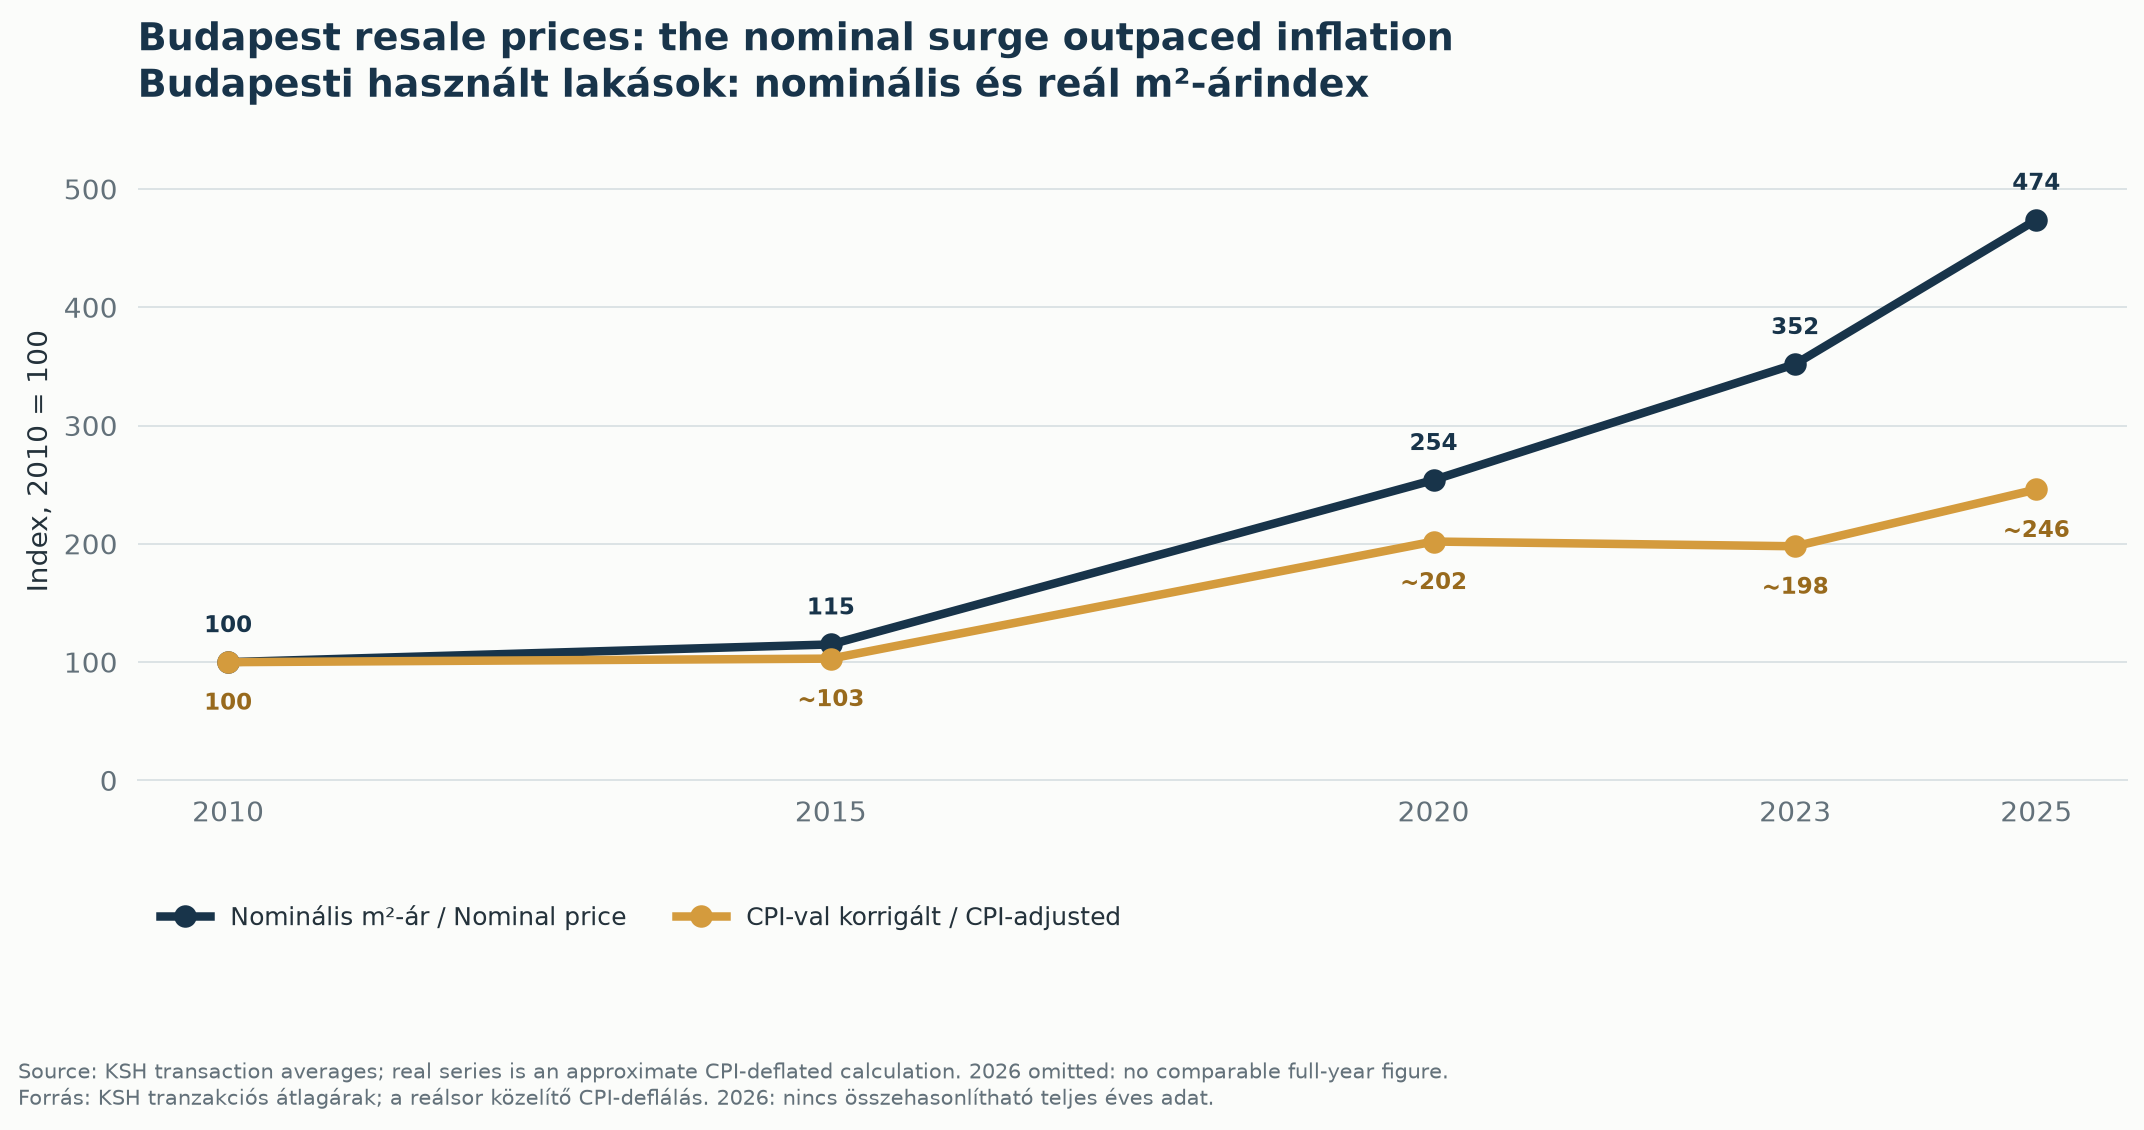
Figure 1. 2026 is excluded because a comparable full-year KSH average was not available in early October.
Budapest home prices rose nearly fivefold, but not in a straight line
KSH transaction averages put the price of a used Budapest home at HUF 252,000 per square metre in 2010, HUF 290,000 in 2015, HUF 640,000 in 2020, HUF 887,000 in 2023 and HUF 1.194 million in 2025. That is a 4.74-fold nominal increase from 2010 to 2025. A simple calculation adjusted for consumer-price inflation suggests that the real increase was about 2.46-fold, so the rise was much more than a reflection of general inflation.
New homes started from a higher level and retained that premium: Budapest’s average rose from HUF 351,000 per square metre in 2010 to HUF 1.61 million in 2025. These are transaction averages, not a repeat-sales index of identical homes. The size, location and type of homes sold can change from year to year, so averages should be read alongside quality-adjusted indices.
Four market phases shaped the cycle
2010-2013: deleveraging and a supply slump. The burden of foreign-currency mortgages, weak credit demand and uncertain income prospects held back purchases. The average Budapest price per square metre for a used home fell from HUF 252,000 in 2010 to HUF 226,000 in 2013. Construction also hit a low, leaving the market with limited supply as the next upswing began.
2014-2019: cheaper credit and an investor-led boom. Lower interest rates, improving employment, state support and tourism-related investment all strengthened demand. Between 2015 and 2019, the average price per square metre of a used Budapest home more than doubled. New construction responded with a lag, so the first demand shock was felt more in prices than in completed homes.
2020-2023: shock, inflation and a real-price correction. Covid first hit short-term letting and the rental market in Budapest. Reopening and inflation then drove a nominal price surge in 2021-2022, before higher rates made financing more expensive. Transaction volumes fell in 2023 while nominal prices moved only modestly. With inflation running high, that still amounted to a substantial correction in real terms.
2024-2025: recovery, then subsidised demand. Transactions picked up, and the Home Start Programme, launched in September 2025, brought more first-time buyers and mortgage demand into the market. The MNB reports that first-time buyers’ share in Budapest rose from about 25% to 40% in a year. Subsidised loans accounted for 81% of housing-loan contracts by the first quarter of 2026. The programme improved financing for eligible households, but in the short term it also added price pressure where supply could not respond quickly.
2026: a clear slowdown, not proof of a broad crash
The MNB’s quality-adjusted Budapest house-price index increased by 1.9% in the first quarter of 2026, then fell by 0.6% quarter on quarter in Q2. Annual growth slowed from 15.9% to 8.3% over the same period. That is a change in momentum, not, by itself, evidence of a broad nominal price decline.
The distinction between measures matters. KSH’s average transaction price depends partly on the mix of homes sold in a particular period. The MNB index aims to account for changes in property quality. They answer different questions: one is a price per square metre, the other an index of underlying price change.
Supply is starting to catch up with demand
Budapest completed 3,949 homes in 2025, well below the 6,341 completed in 2020. In the first half of 2026, 2,224 new homes were completed, 22% more than a year earlier. The development pipeline is larger still: MNB data show about 22,000 homes under development or for sale in Budapest in Q1 2026, including a record 9,490 new homes still available to buy. KSH recorded permits for 6,560 Budapest homes in the first half of 2026, with three quarters concentrated in Districts XIII and IX.
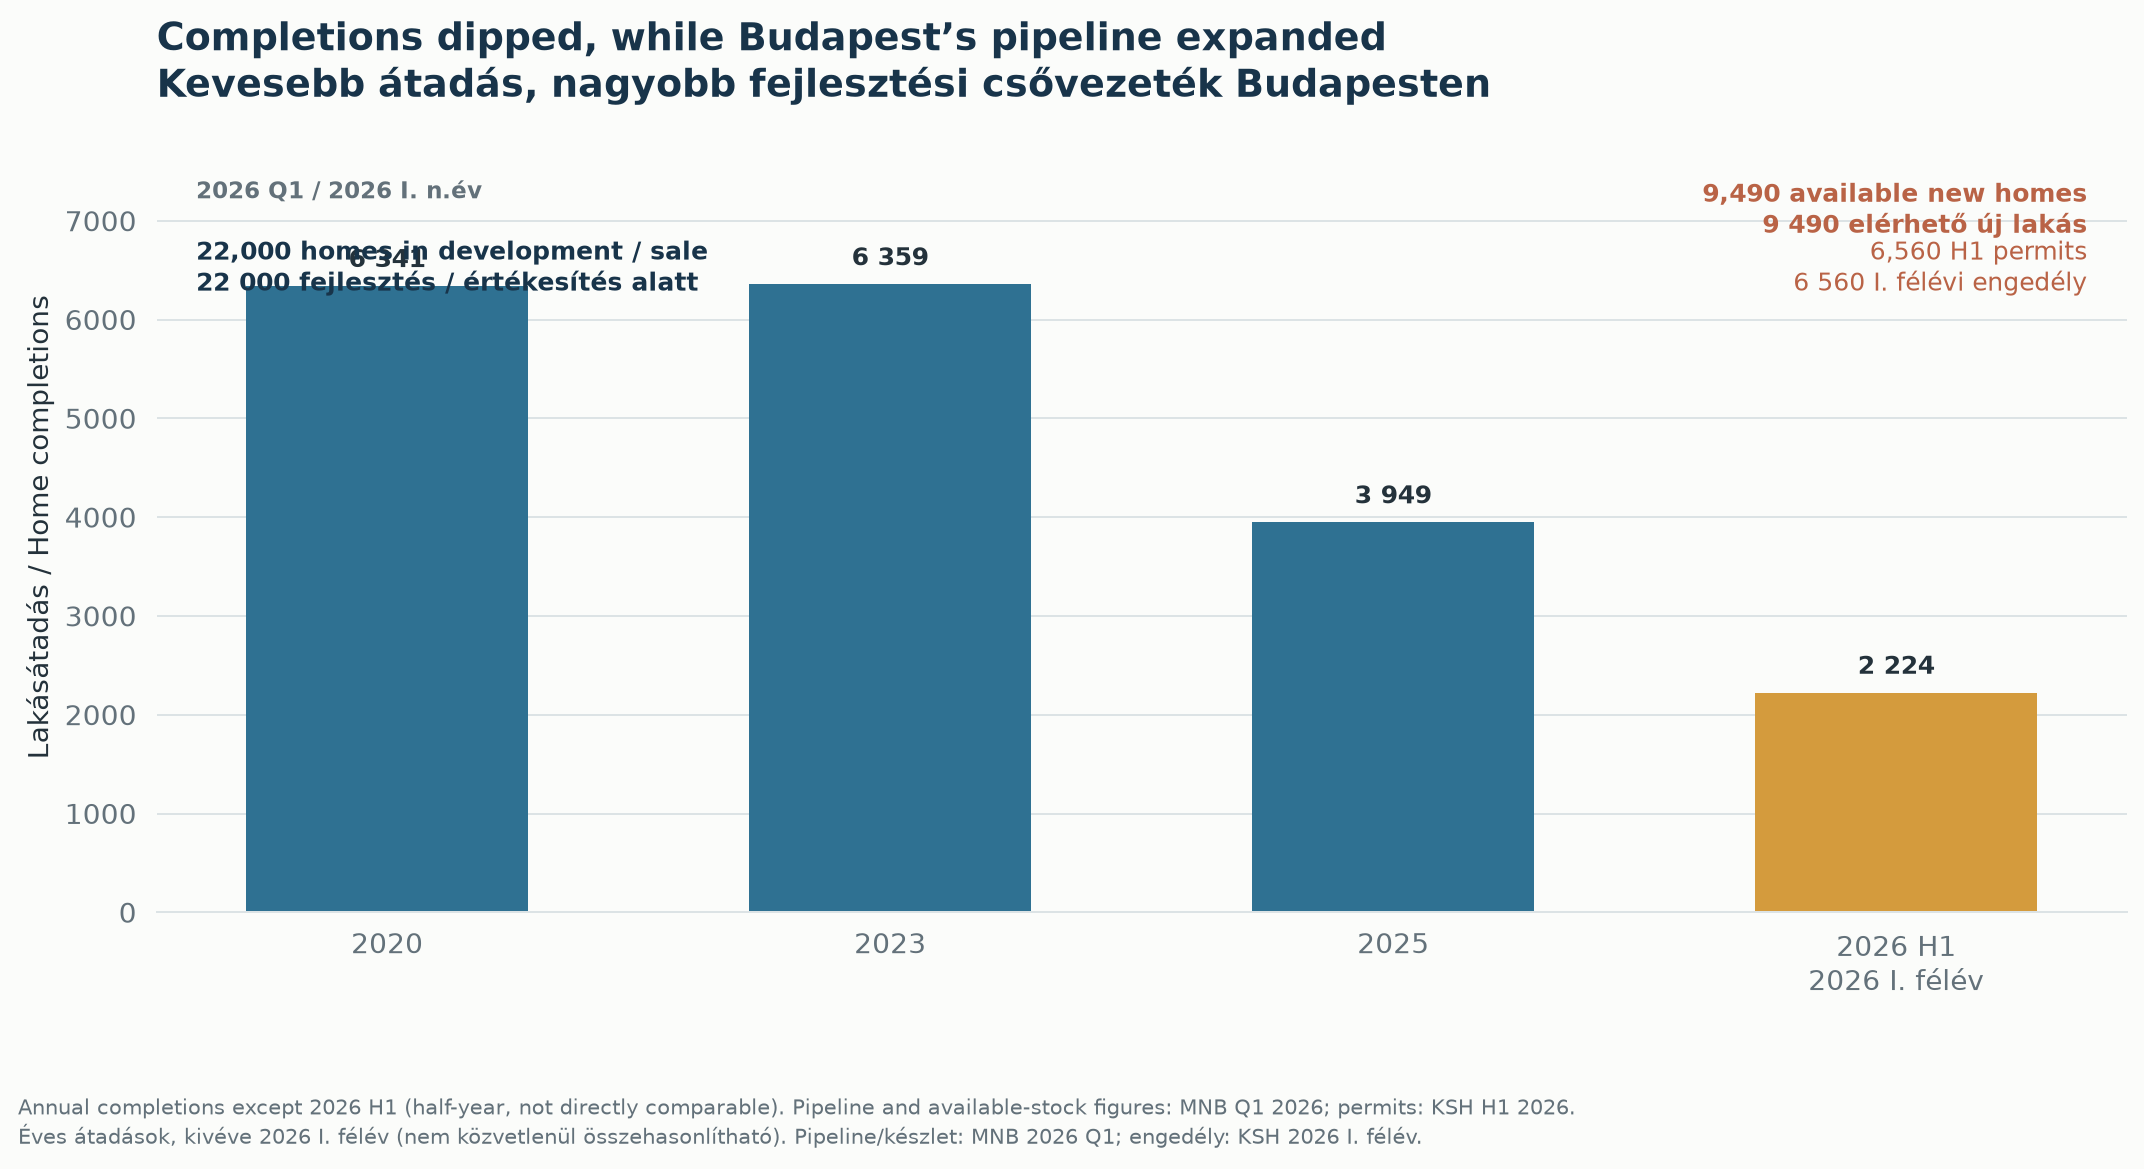
Figure 2. The 2026 figure covers six months and is not directly comparable with annual completions. Permits and homes in the pipeline are not completed homes.
The key question for the next few years is how quickly announced projects become homes ready to occupy. A building permit is not a completed apartment, and developments can be delayed. Still, more choice may strengthen buyers’ negotiating position, especially in the higher-priced new-build segment.
Sale prices have outpaced rents
From 2015 to 2025, the average Budapest transaction price for a used home increased about 4.12-fold, while the nominal KSH-ingatlan.com advertised-rent index rose about 2.12-fold. If property size, occupancy and costs are held constant, the simple rent-to-price ratio falls to roughly 52% of its 2015 level. This is an illustrative yield proxy, not a gross or net rental-yield calculation: it excludes vacancy, tax, maintenance, financing and differences in property mix.
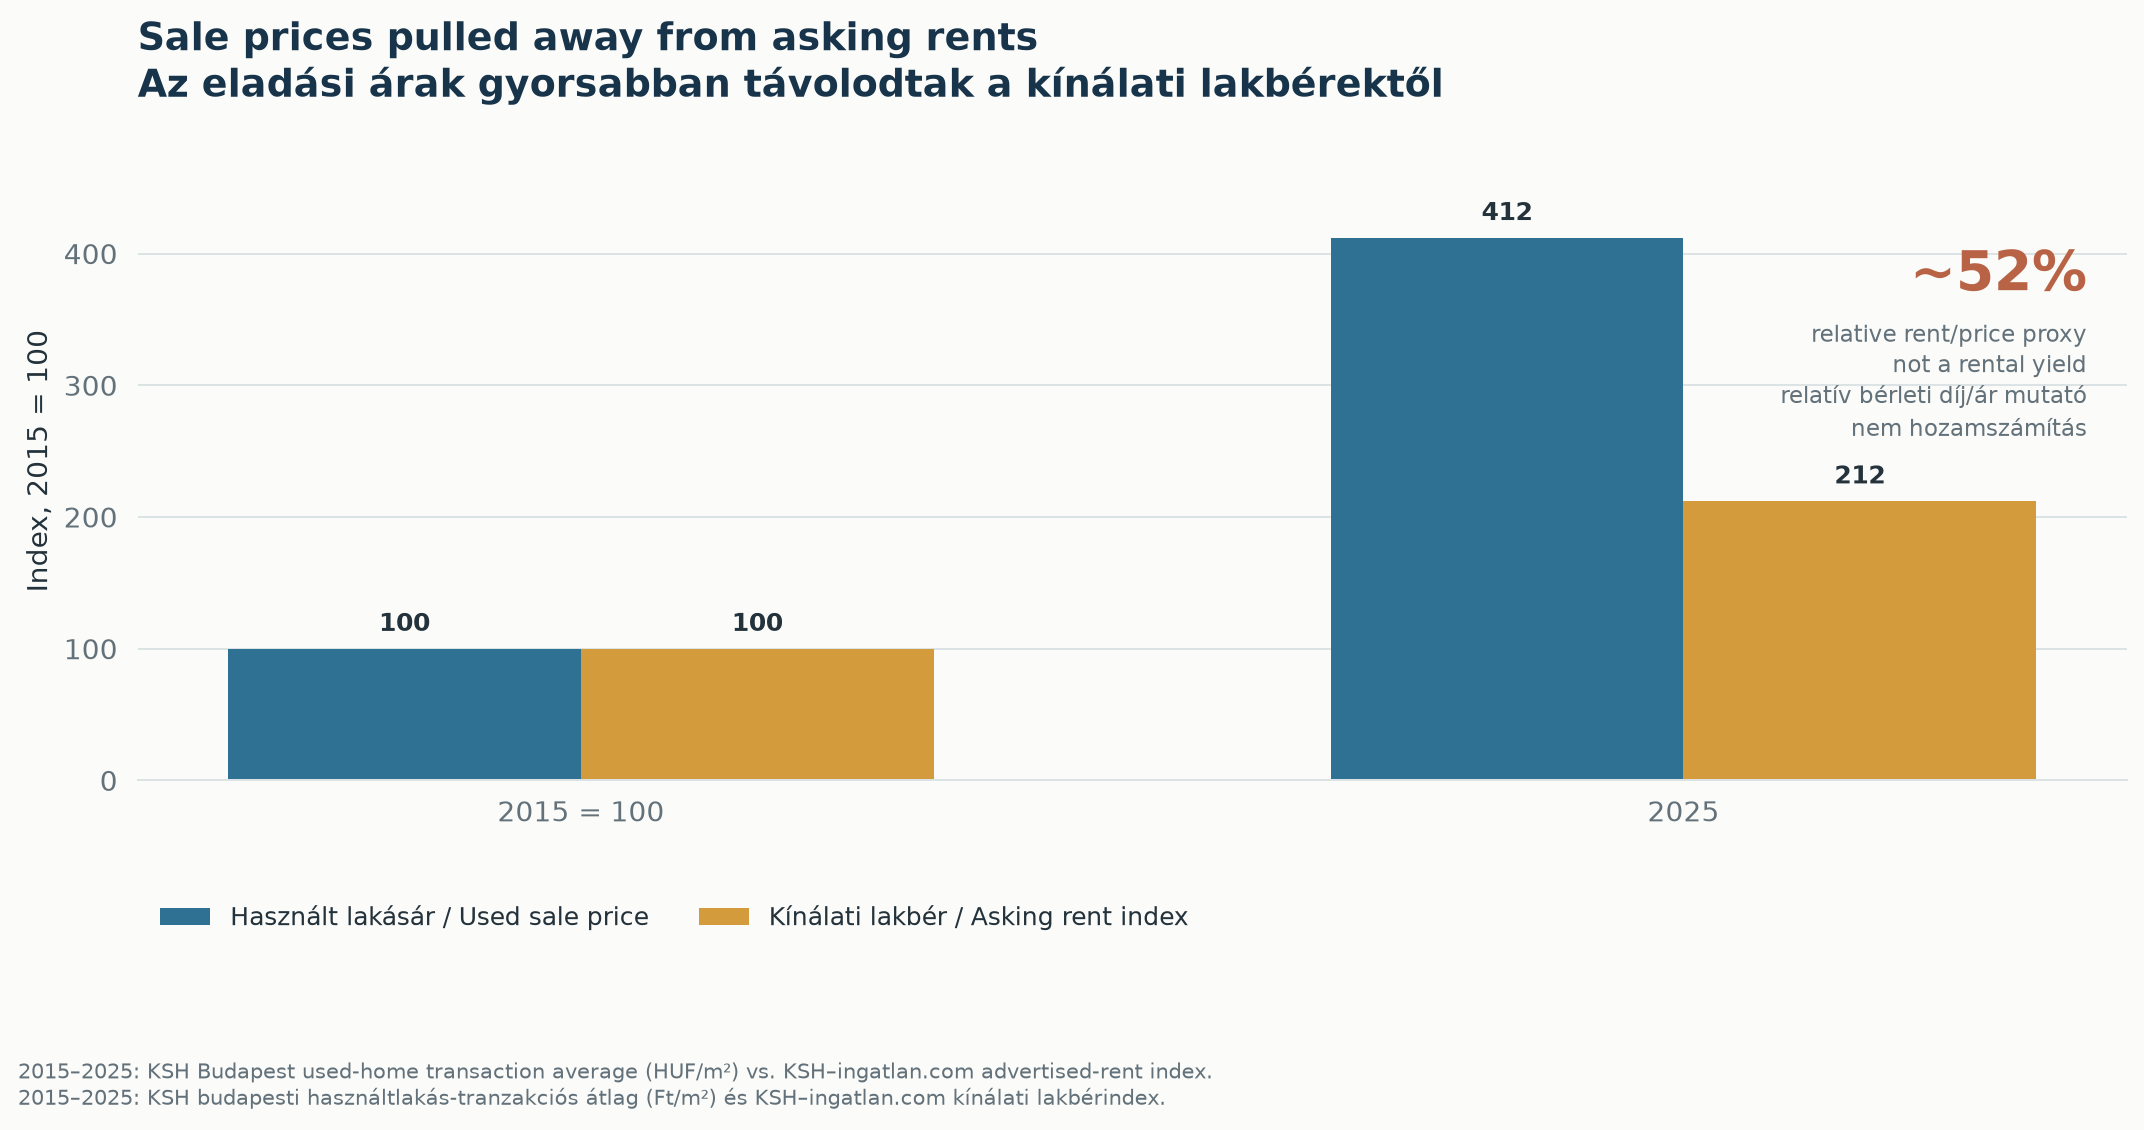
Figure 3. Different types of measures are being compared, so the ratio is directional only. In August 2026, Budapest asking rents were 5.2% higher year on year and about 78% above their 2021 level in nominal terms.
For investors, the implication is straightforward: price appreciation alone is less persuasive as an investment case. Micro-location, achievable rent, operating costs, tax treatment and regulation of short-term letting matter more. Owners can review Tower’s Budapest property-management services; current long-term rental listings in Budapest provide a live view of the choices competing for tenants.
The “Budapest average” hides several different markets
Inner Pest apartments, premium Buda homes, family houses in outer districts and panel apartments do not compete for the same buyers. Greater affordability pressure has helped support demand for homes with a lower total purchase price, including panel flats. In Q1 2026, KSH reported that Budapest panel prices were up 18% year on year, compared with 7.8% for non-panel apartment buildings and 4.9% for family houses. One citywide average can therefore conceal very different movements across segments.
District patterns differ too. New-home development is concentrated in Districts XIII and IX, while outer districts may offer an alternative for buyers priced out of central areas. Instead of relying on a district label alone, compare the building’s condition, transport access, property type and direct competitors.
What to watch through 2027 and 2028
A reasonable base case for 2027-2028 is moderate nominal growth rather than another boom like 2025. One scenario in the source analysis sketches growth of 4-7% in 2027 and 3-6% in 2028. Treat this as a conditional scenario, not an official central-bank forecast.
Upside risk would come if subsidised demand and cheaper market-rate credit grew faster than homes were actually completed. Downside risks include high valuations, compressed rental returns and the growing stock of new homes. The likeliest result is not that every Budapest home rises or falls together, but that the gap widens between well-priced properties that meet demand and overpriced homes that are harder to let or sell.
The cycle shift makes property-level decisions more important
Since 2010, nominal Budapest home prices have risen almost fivefold, shaped by credit cycles, inflation, regulation and delayed supply. In 2026, price growth slowed as buyer composition and the new-build pipeline changed. Budapest remains a substantial property market, but “Budapest” alone is no longer an investment strategy.
Whether you plan to buy, sell or rent out a home, base the decision on the numbers for the specific property and neighbourhood. For more local context, browse Tower’s Budapest property market news. Owners considering a sale can also review Tower’s Budapest property sales service and listings.
Data and methodology
KSH square-metre prices are averages of completed transactions. The MNB house-price index is quality-adjusted. They measure different things and are not interchangeable. The 2010-2025 real-price index is an approximate calculation adjusted using the KSH consumer-price index. The rent-to-price ratio is a relative proxy, not a measured investment yield.
